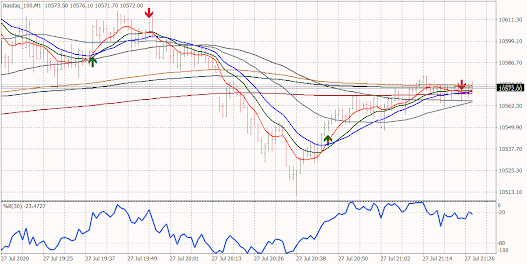
WMA Chart Setup Intraday Trading CITS
Weighted Moving Averages(WMA) cross over Indicator
All new traders get confused with setting up the of the chart with the right technical indicators, The best Intraday Trading Strategy Setup is the WMA Chart Setup with moving averages and the parameter is Weighted. Weighted Moving Averages(WMA) show you the right movement of the averages taking into consideration price as well as the volumes.
If you have these Weighted Moving Averages(WMA) on your chart then you can less depend on the supports, resistances, and pivot points as the moving averages themselves will present you with the dynamic supports and resistances in various time frames.
Entering a trade without a proper intraday trading setup is a disaster in the making. Most of the traders enter a trade without knowing the technicals and enter randomly which within a short time turns out to be failures.
How to Setup the Chart with Weighted Moving Averages Indicator(WMA) in MT4
Go to Indicators and select moving averages
In parameters select period, style: any color
MA method: linear weighted
apply to weighted HLCC/4
and in visualization select all time frames.
Continue the process for different time periods like 10, 20, 30, 60, 200 with different colors and line weights if you need it.
save the template with a name.
now open the chart and apply the template to your stock. check different time frames you will notice the supports and resistances in each time frame.
Before entering into trading, pause a little, take a breath. Do not press the trigger immediately. check for the right setups.
Go long if it is trading above the moving averages and short if moving below the moving averages.
Wait for the right opportunity as per your planned trading setup and then enter. Ask yourself Am I Right? Will this lead me to profit or Loss? If You are sure Only then make an entry.
If you are bullish on a particular x stock or gold it does not mean that it actually flies on the trading day. Look for the chart what it says that is more important like on the particular trading day it may be consolidating or making a correction or maybe volatile so considering the actual movement one should trade accordingly for an intraday trade.
 |
Weighted moving averages Intraday Trading Strategy setup nasdaq |
The best MT4 Chart Setup for Intraday Trading Strategy
In an intraday chart, one should be able to find out the long-term movement and the smaller time frames of the chart to make a good entry and exit strategy.
If you want to follow this here is a step by step details. No complicated technical indicators or details keep it as simple as possible. Only moving averages and williams % will do the trick.
 |
Weighted Moving Averages WMA Chart Setup for Gold |
- Follow the 15min chart.
- In the Chart, if the 10 WMA moves over the 30 WMA with volumes make an entry (check the chart above) with stop loss below the low, book profits at your comfort levels, or wait till the 10WMA cross over the 20 WMA for the short side also wait until confirmation of 10 WMA moving over 20 WMA and then enter placing the stop loss above the recent high.
- Analyze the chart above and practice, make a clear understanding of the strategy, go back in the chart for over a month get to know, and then trade.
- For knowing the overbought or oversold positions William's % indicator may be used with 30 or 60 periods. This will be useful in checking H1 or H4 charts and make a decision to trade in a 5min chart.
- trader-qualities
first-15-minutes
gold-trading-strategy
drawdown-and-leverages
opening-hour-behavior
advice-from-successful-traders
know-your-trading
consistent-intraday-trading-strategy
last-hour-strategy
money-management-tips
entry-exit-time
common-repetitive-mistakes
trade-techniques
pick-right-stocks
stop-loss-placing
wma-chart-setup
strong-mind-control
suggestions-for-new-traders
intraday-trades